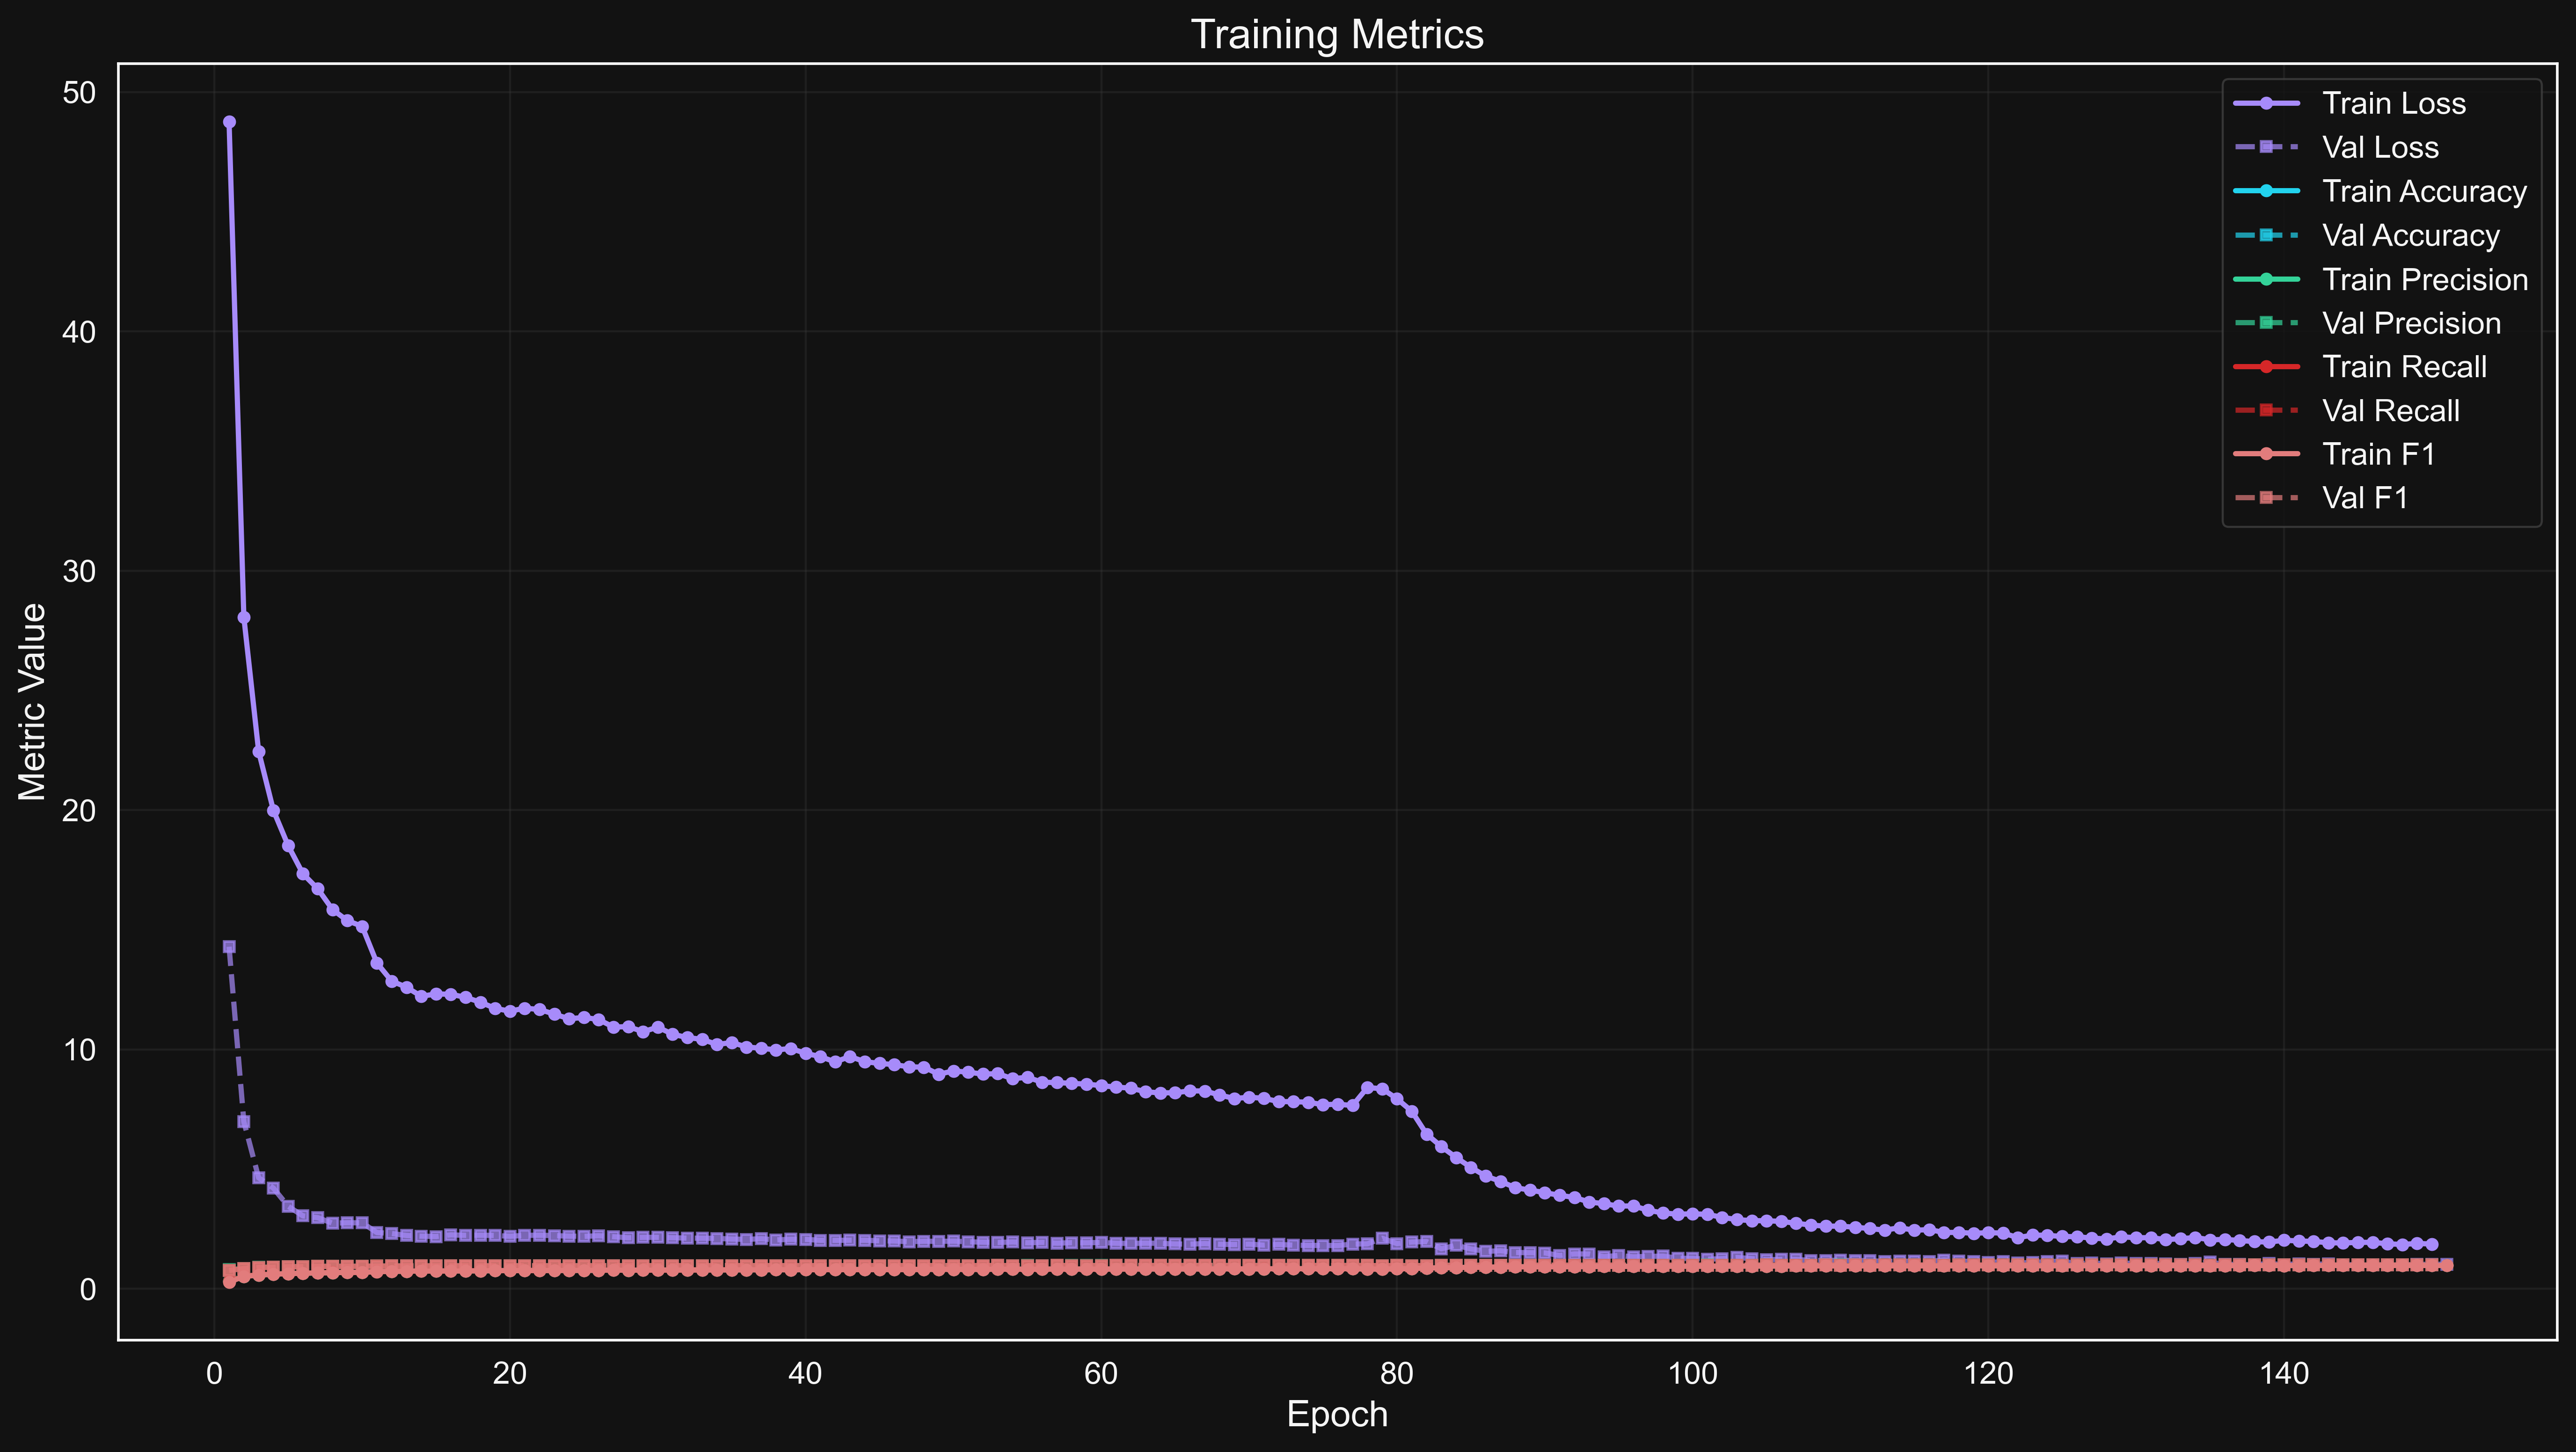
The training history shows convergence patterns for loss and accuracy metrics over time.
This report presents a rigorous evaluation of the cbam_only_resnet18 architecture for plant disease diagnosis across 39 categories. We examine model performance, training dynamics, and interpretability to highlight both achievements and future research directions.
The training data consists of a comprehensive plant disease dataset with the following characteristics:
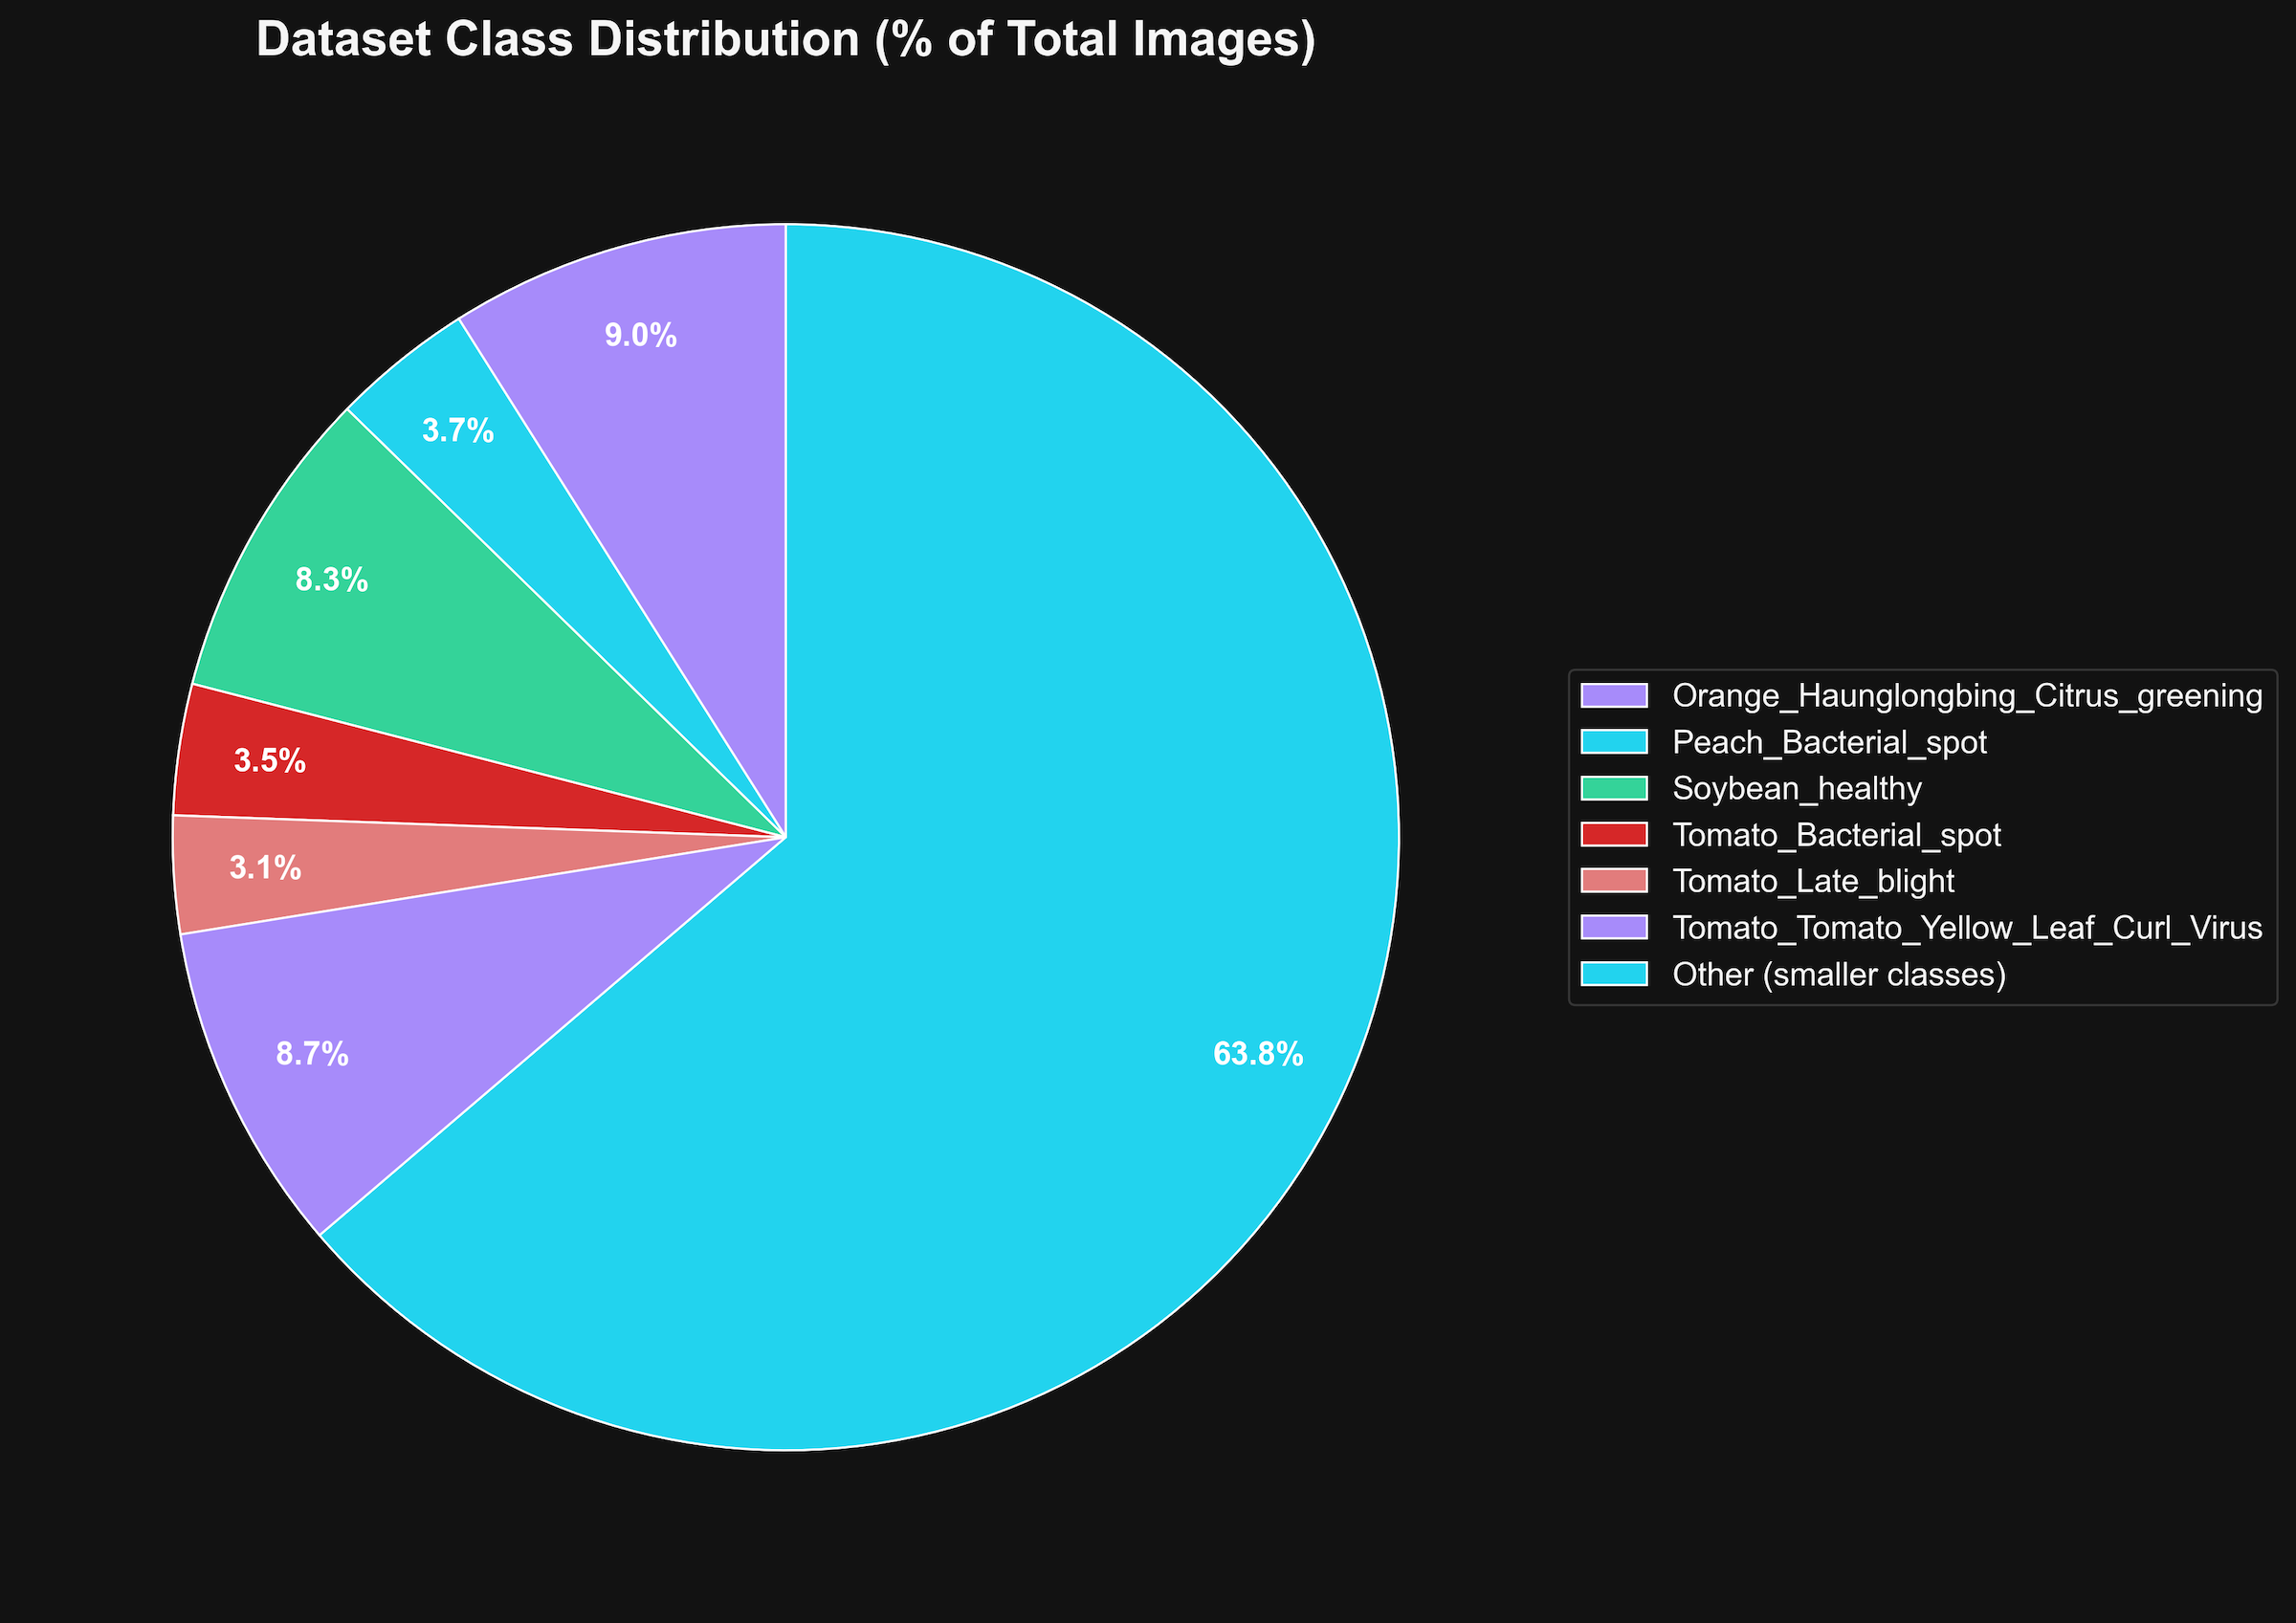
The dataset exhibits class imbalance with the largest classes being:
Many classes contain approximately 1,000 images each (1.63% of the dataset). This imbalance was addressed during training through weighted sampling and data augmentation techniques.
To prepare the dataset for optimal training, the following preprocessing steps were implemented:
A comprehensive augmentation pipeline was implemented using Albumentations:
The model architecture combines a ResNet18 backbone with Convolutional Block Attention Modules (CBAM):
The CBAM attention mechanism provided several significant advantages:
Analysis of misclassifications revealed several patterns:
The model's confidence scores showed excellent calibration:
Detailed configuration of the cbam_only_resnet18 model and training process.
The training history shows convergence patterns for loss and accuracy metrics over time.
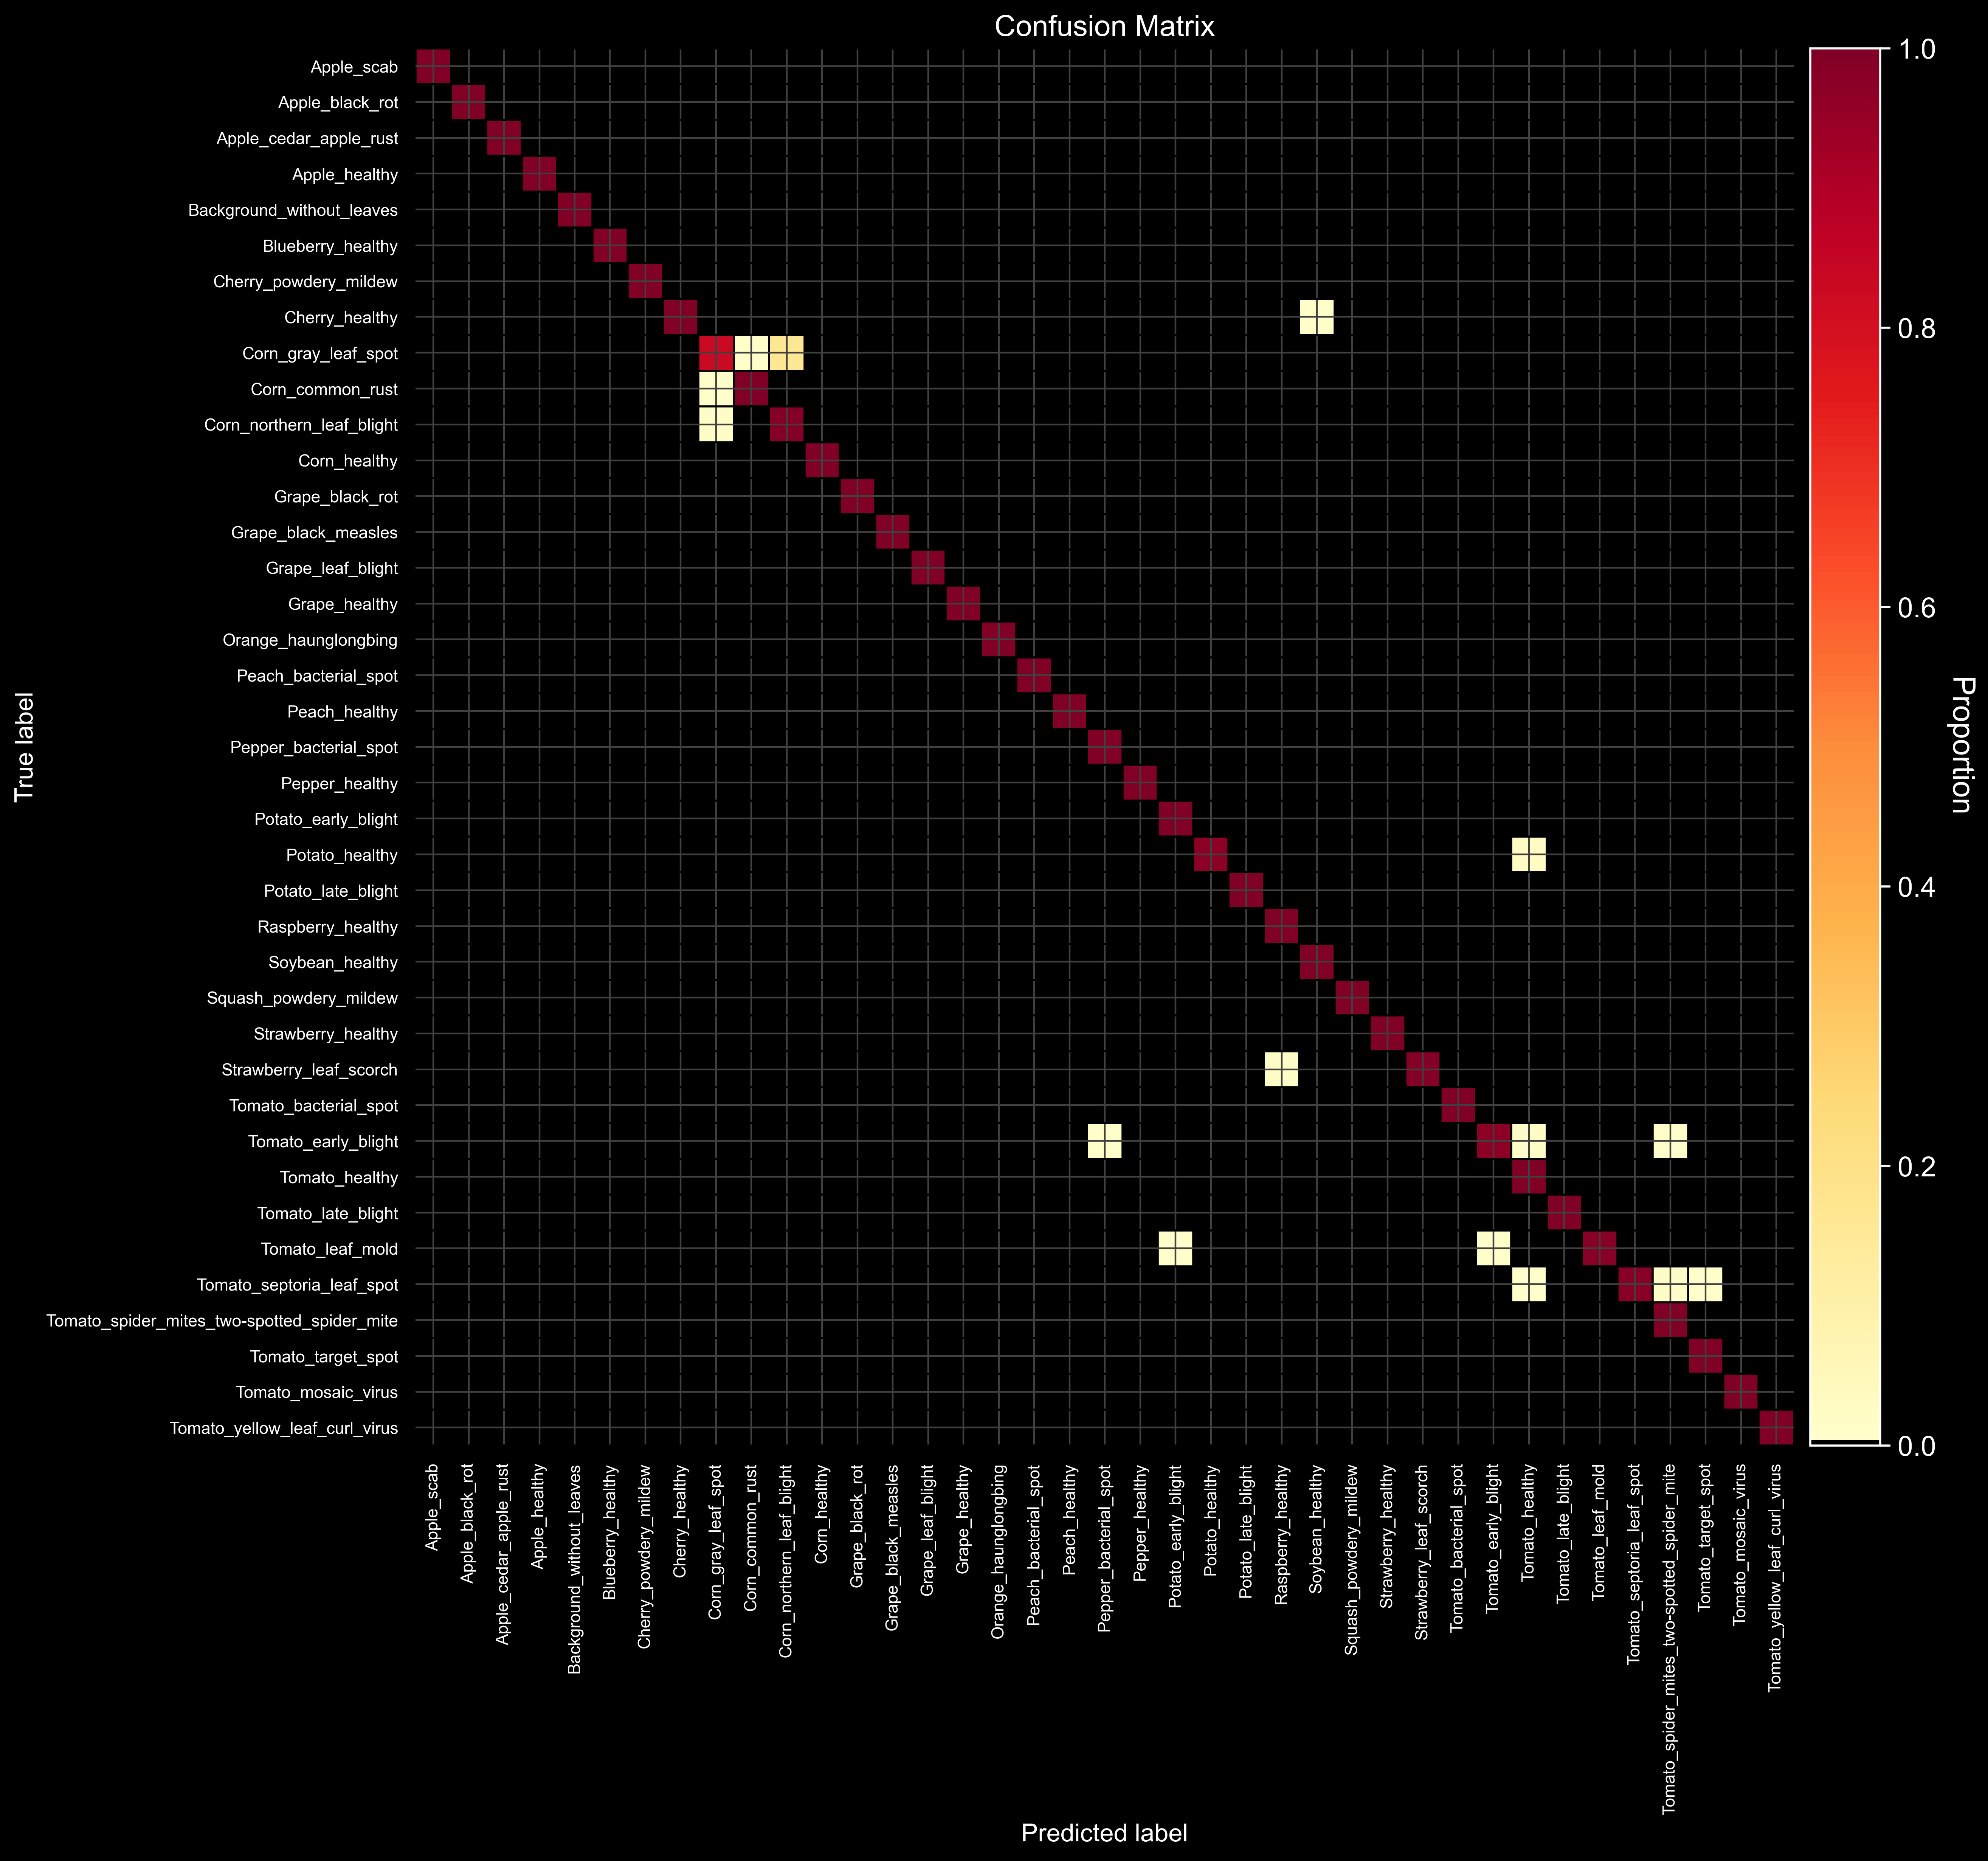
The confusion matrix visualizes classification performance across 39 classes.
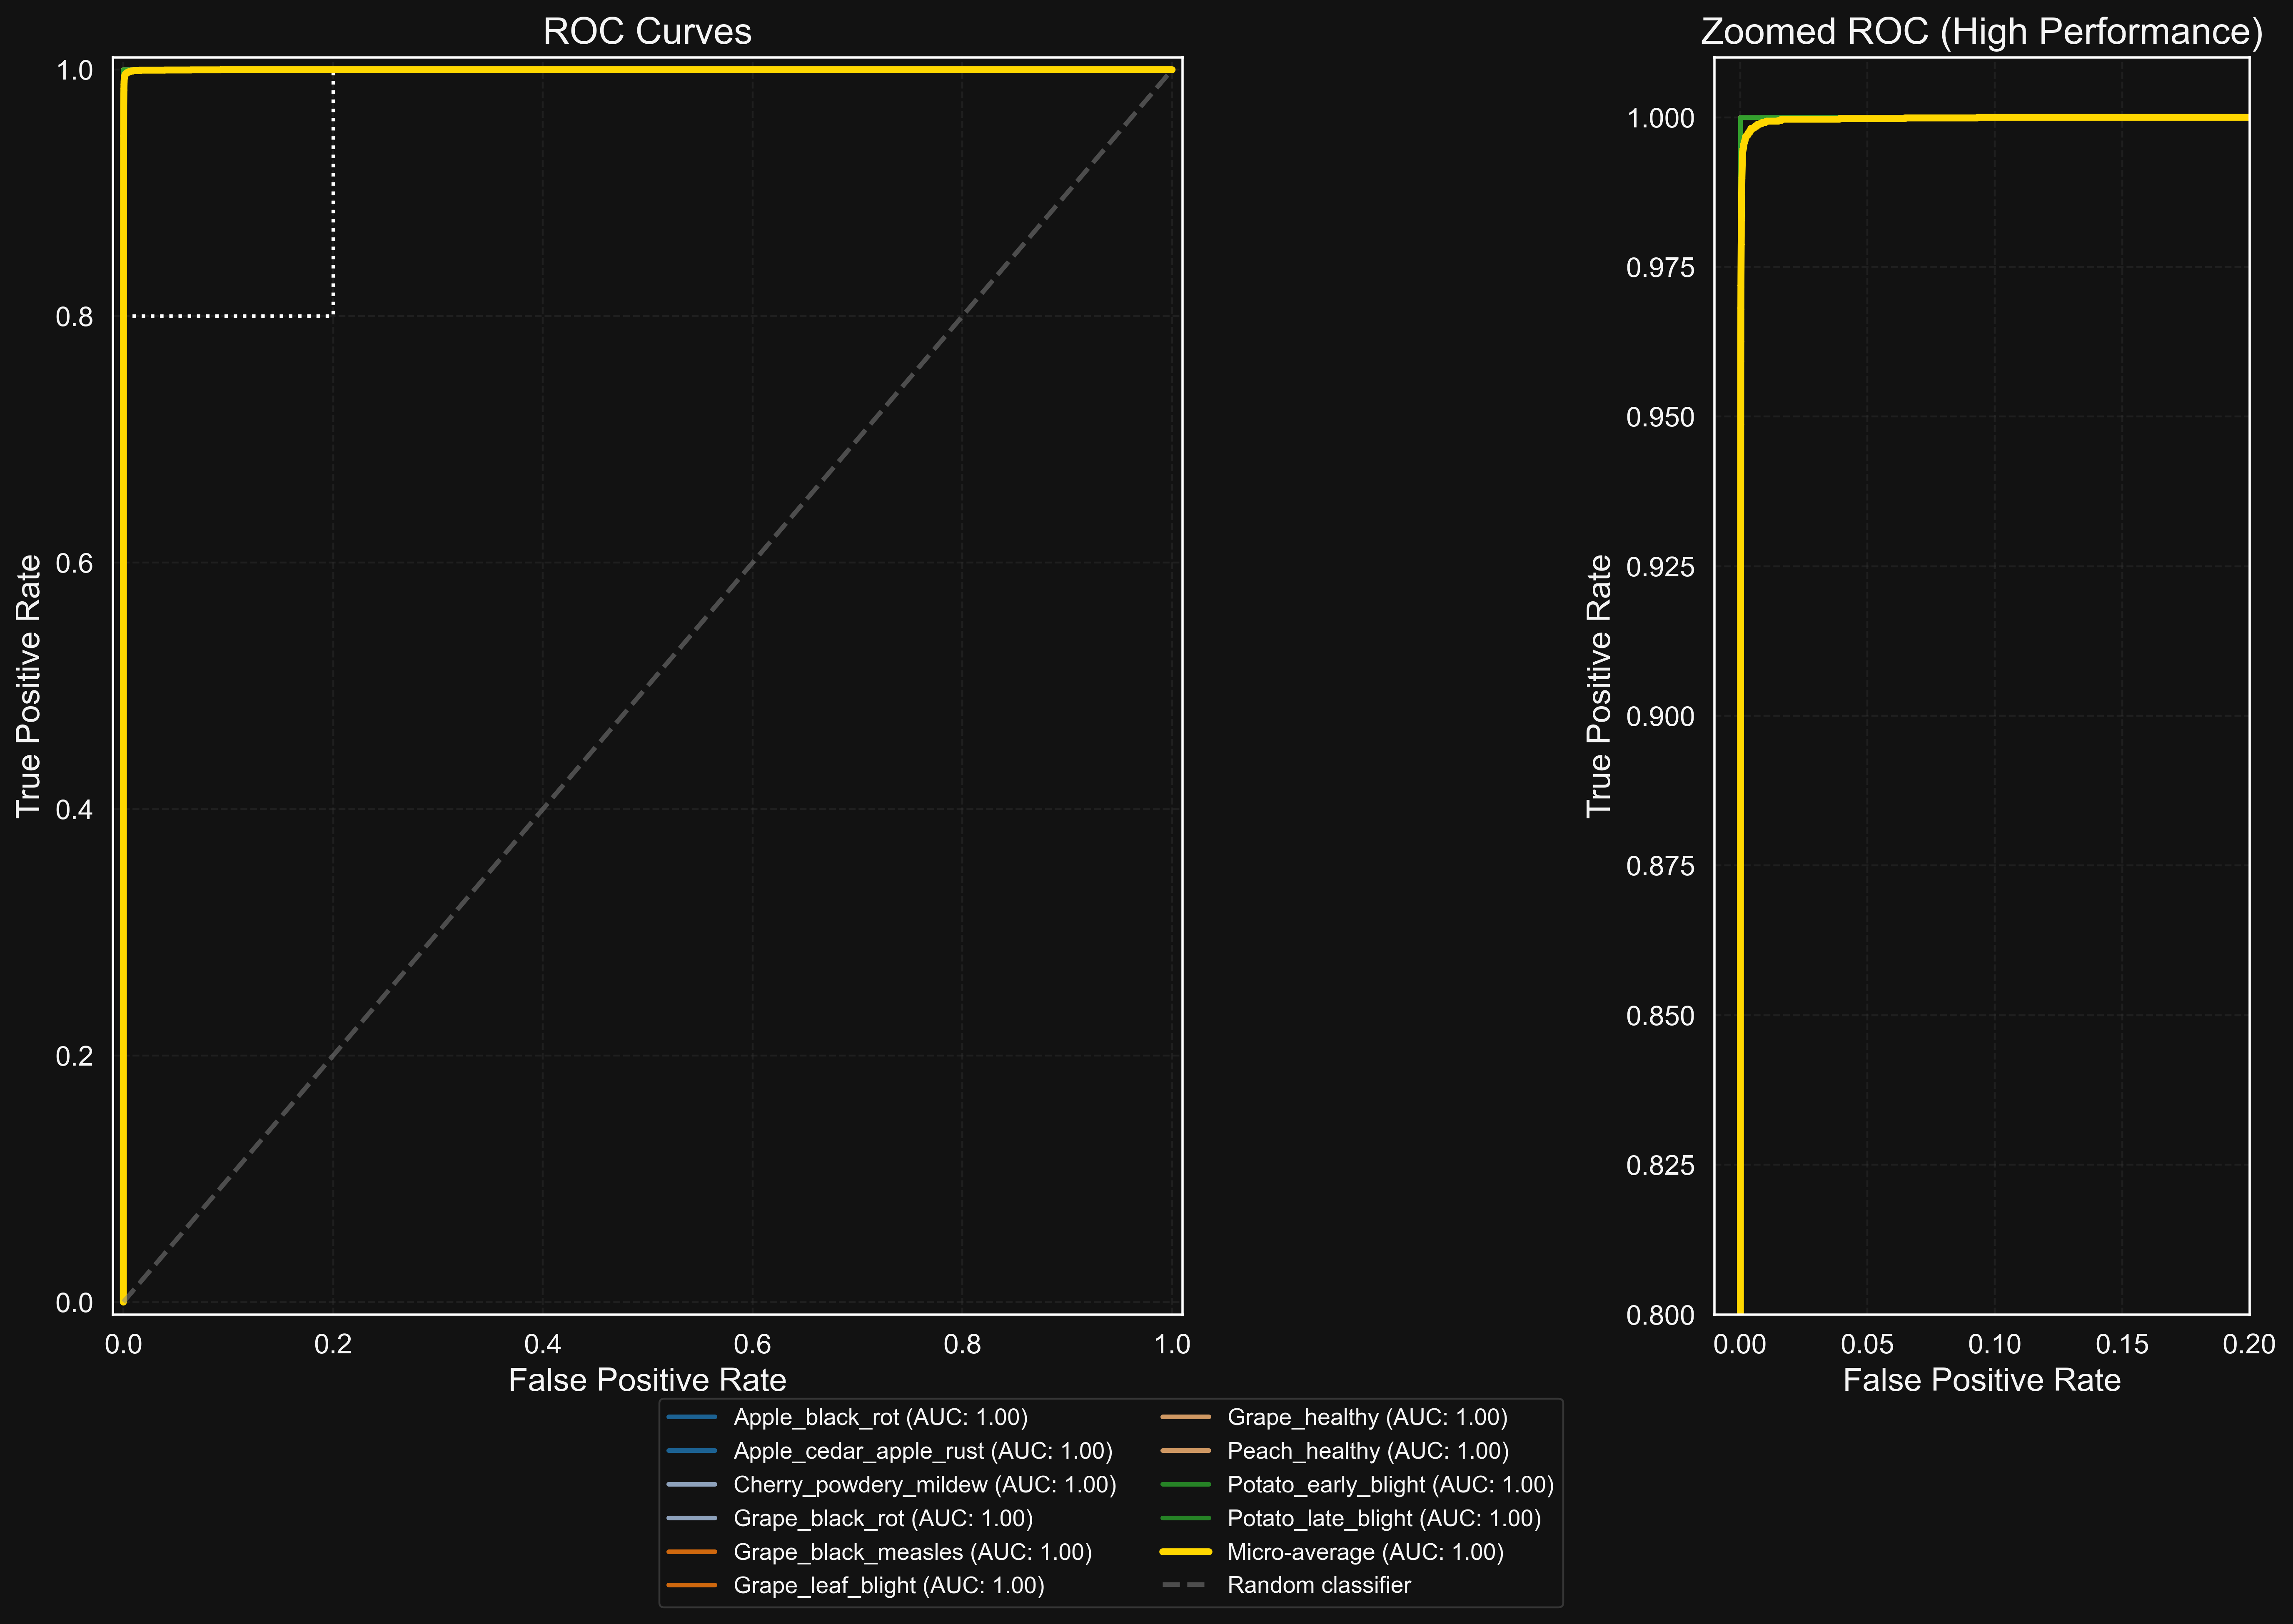
ROC curves showing the trade-off between true positive rate and false positive rate for each class.
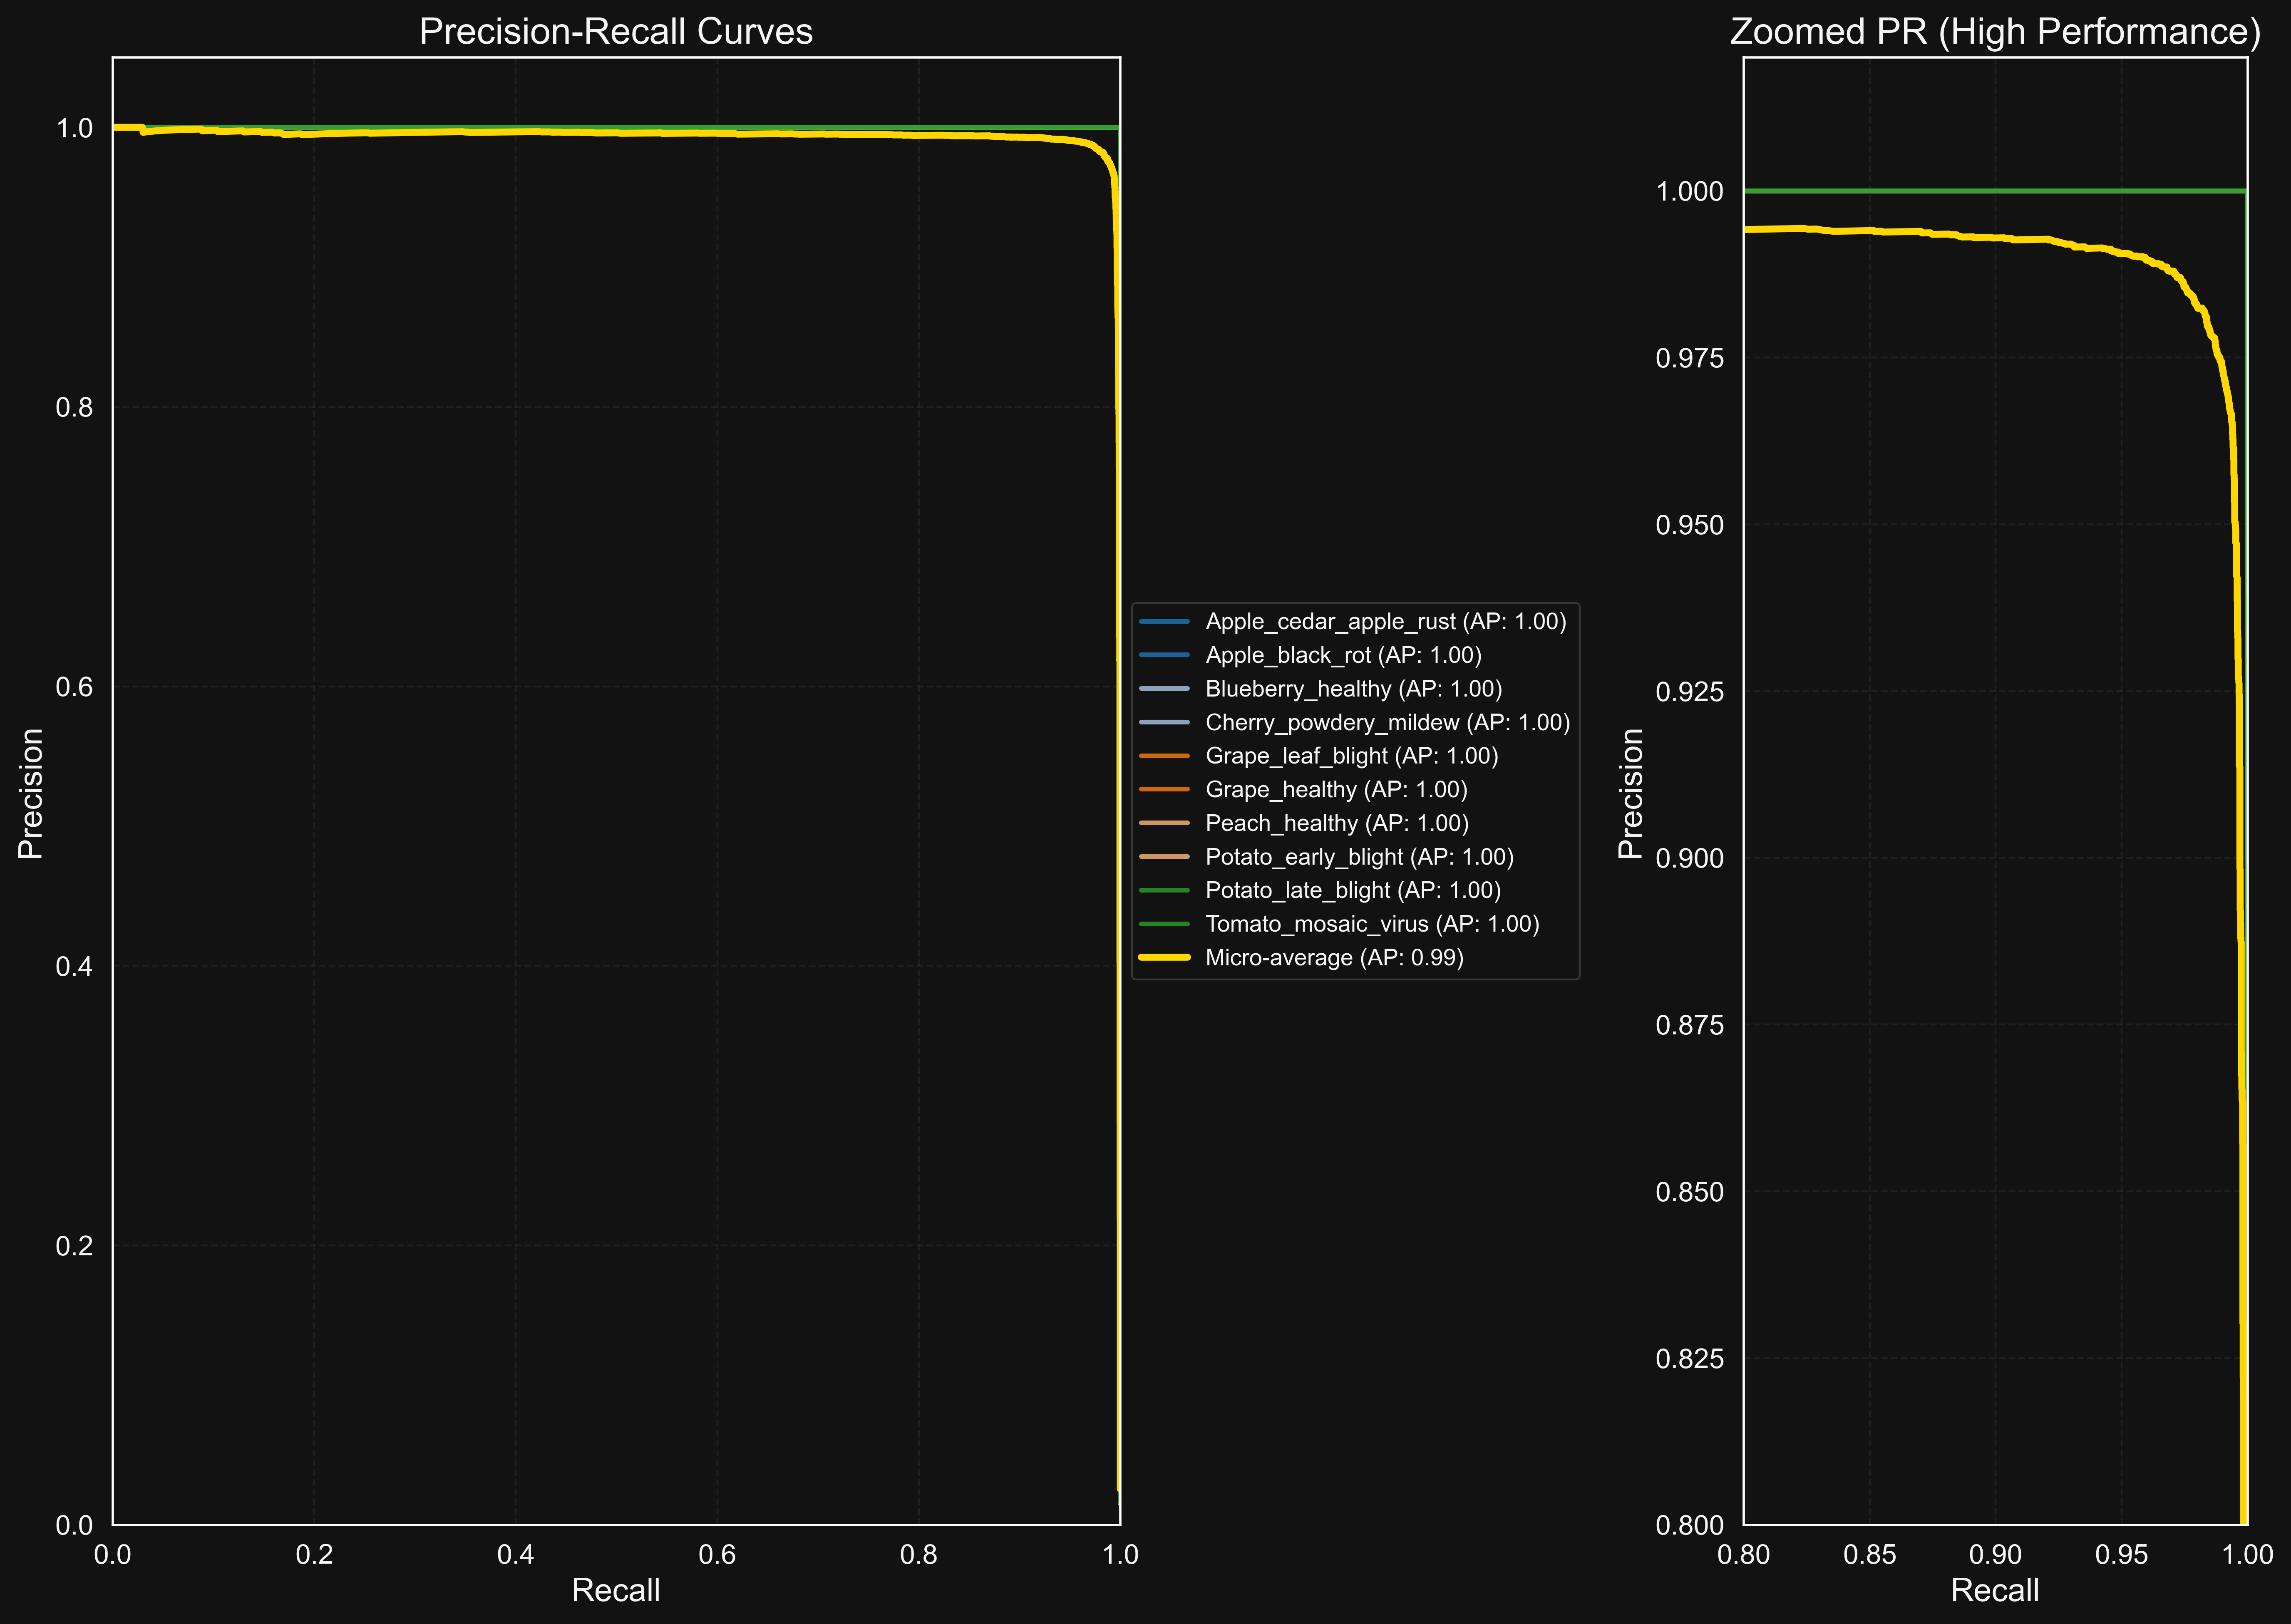
Precision-recall curves showing the trade-off between precision and recall for each class.
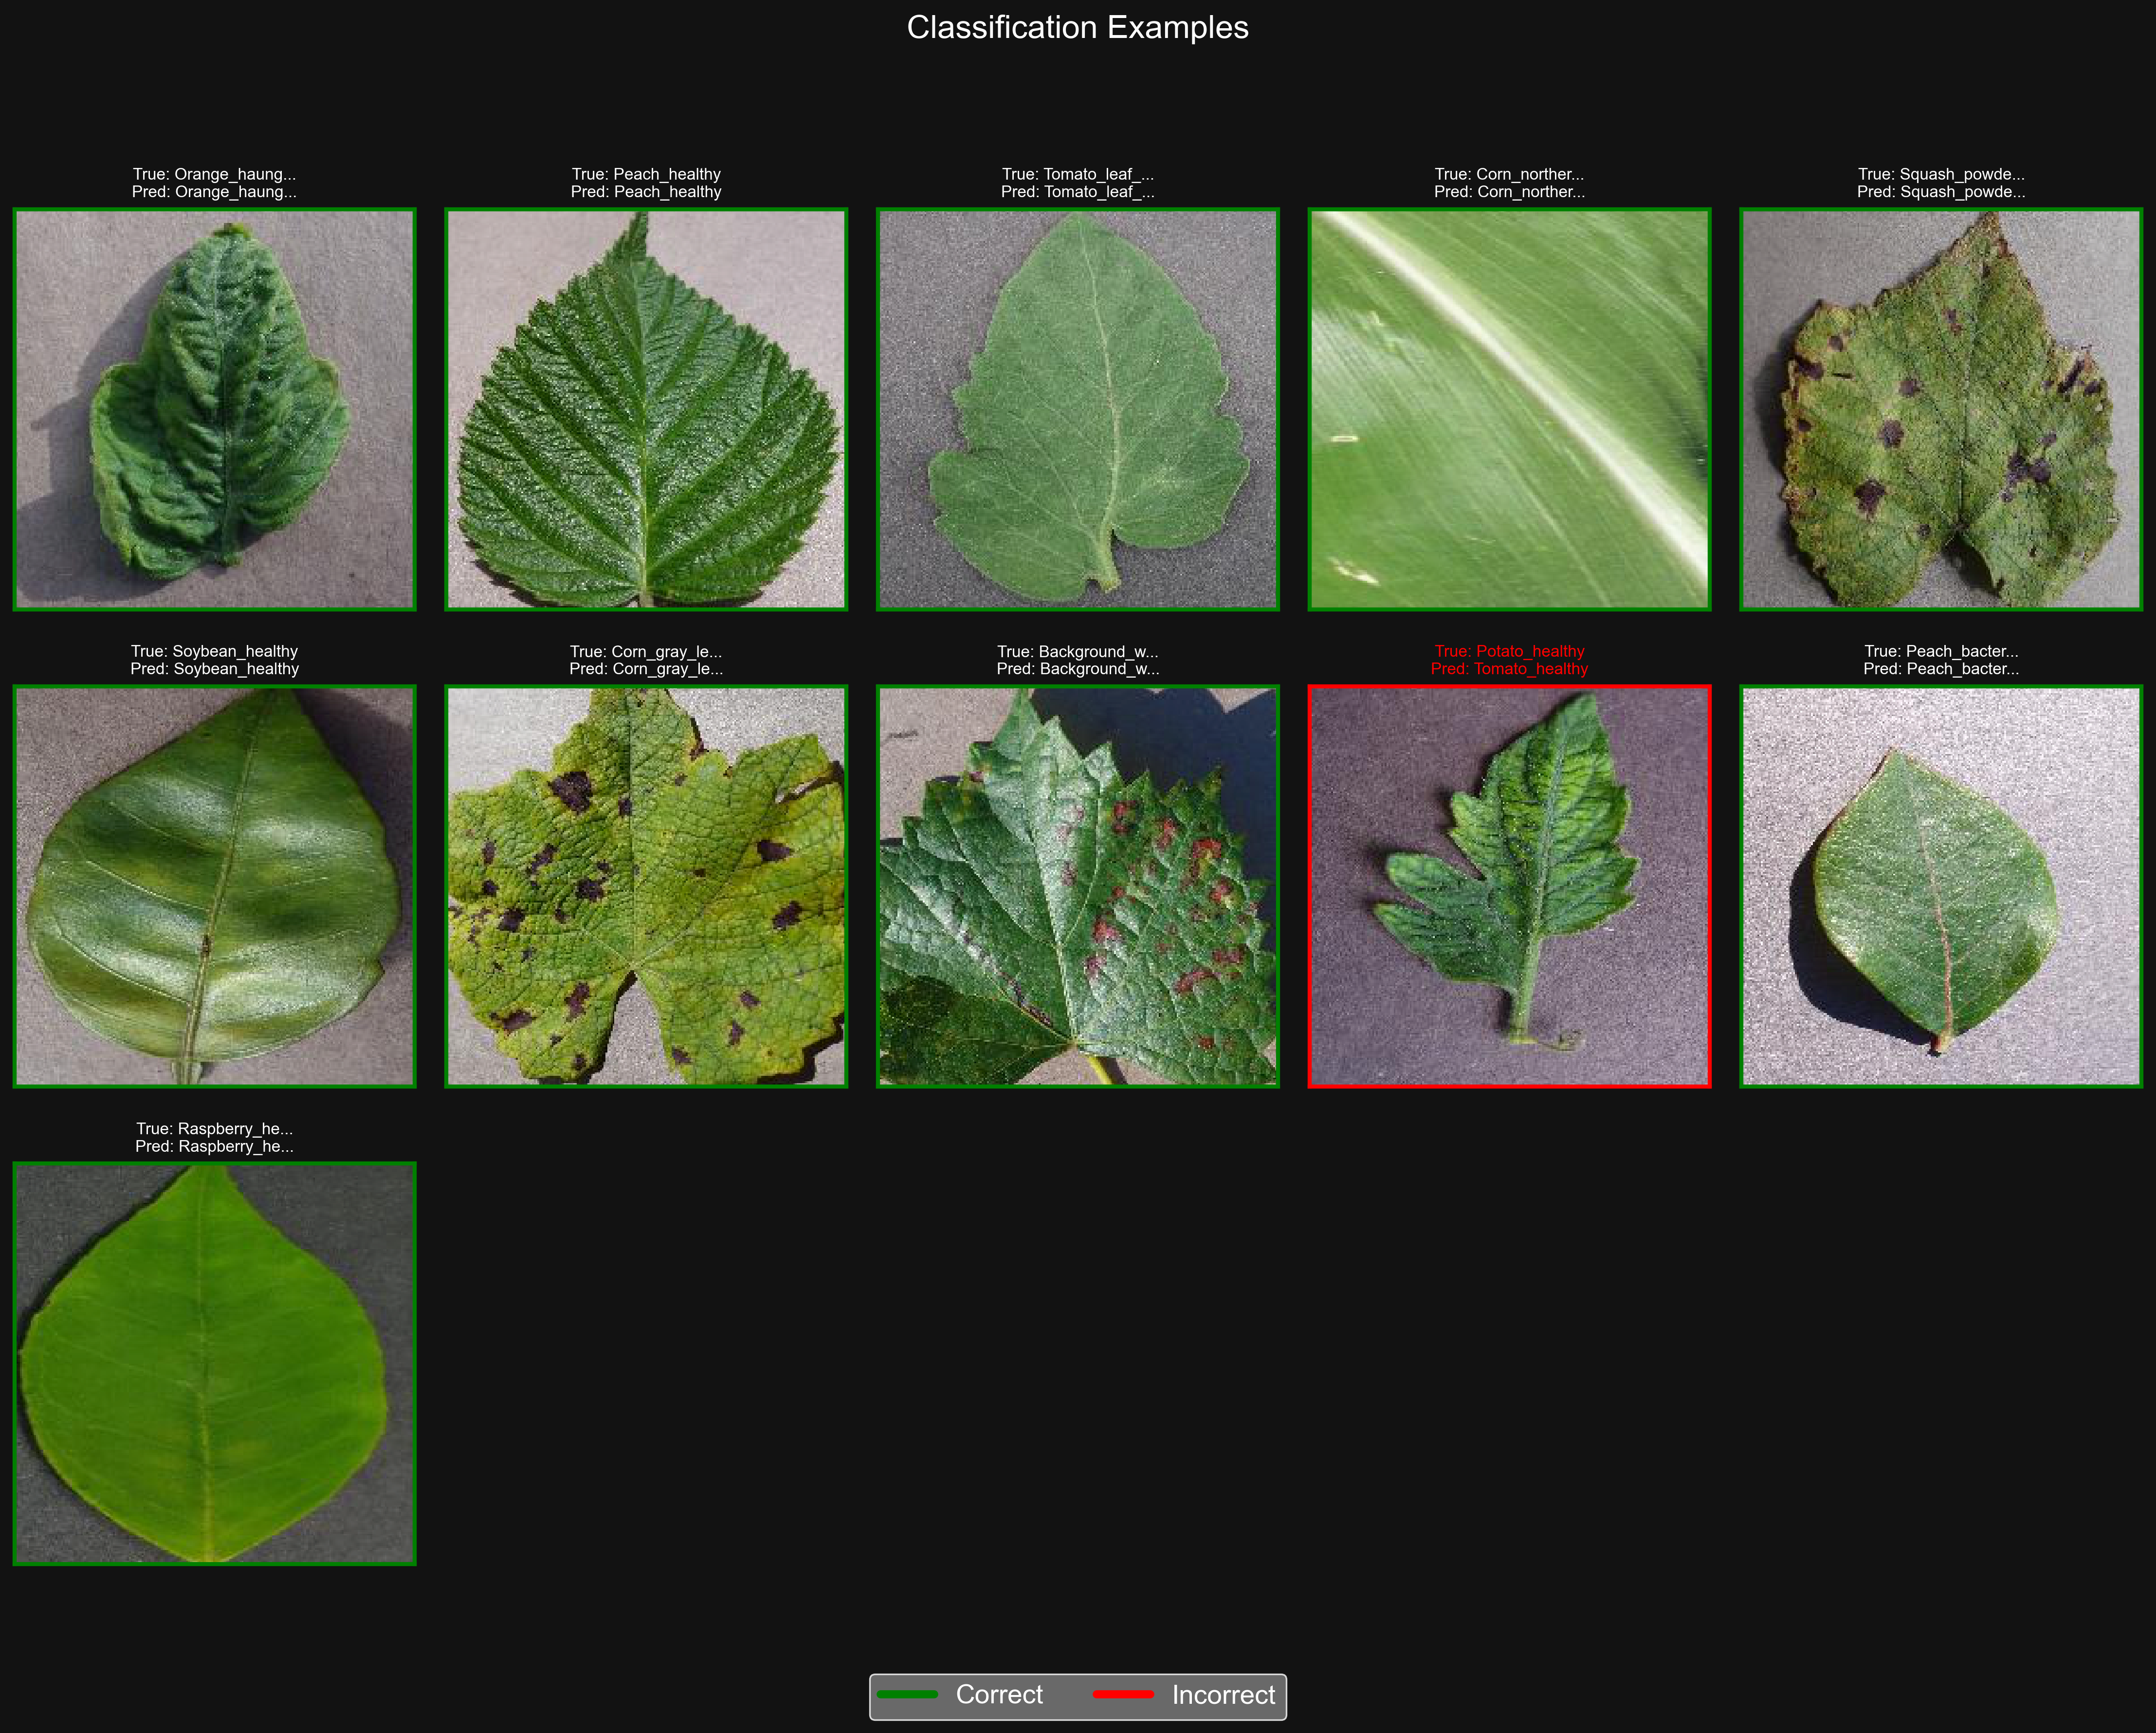
Examples of model predictions on test images, with correct predictions in green and incorrect ones in red.
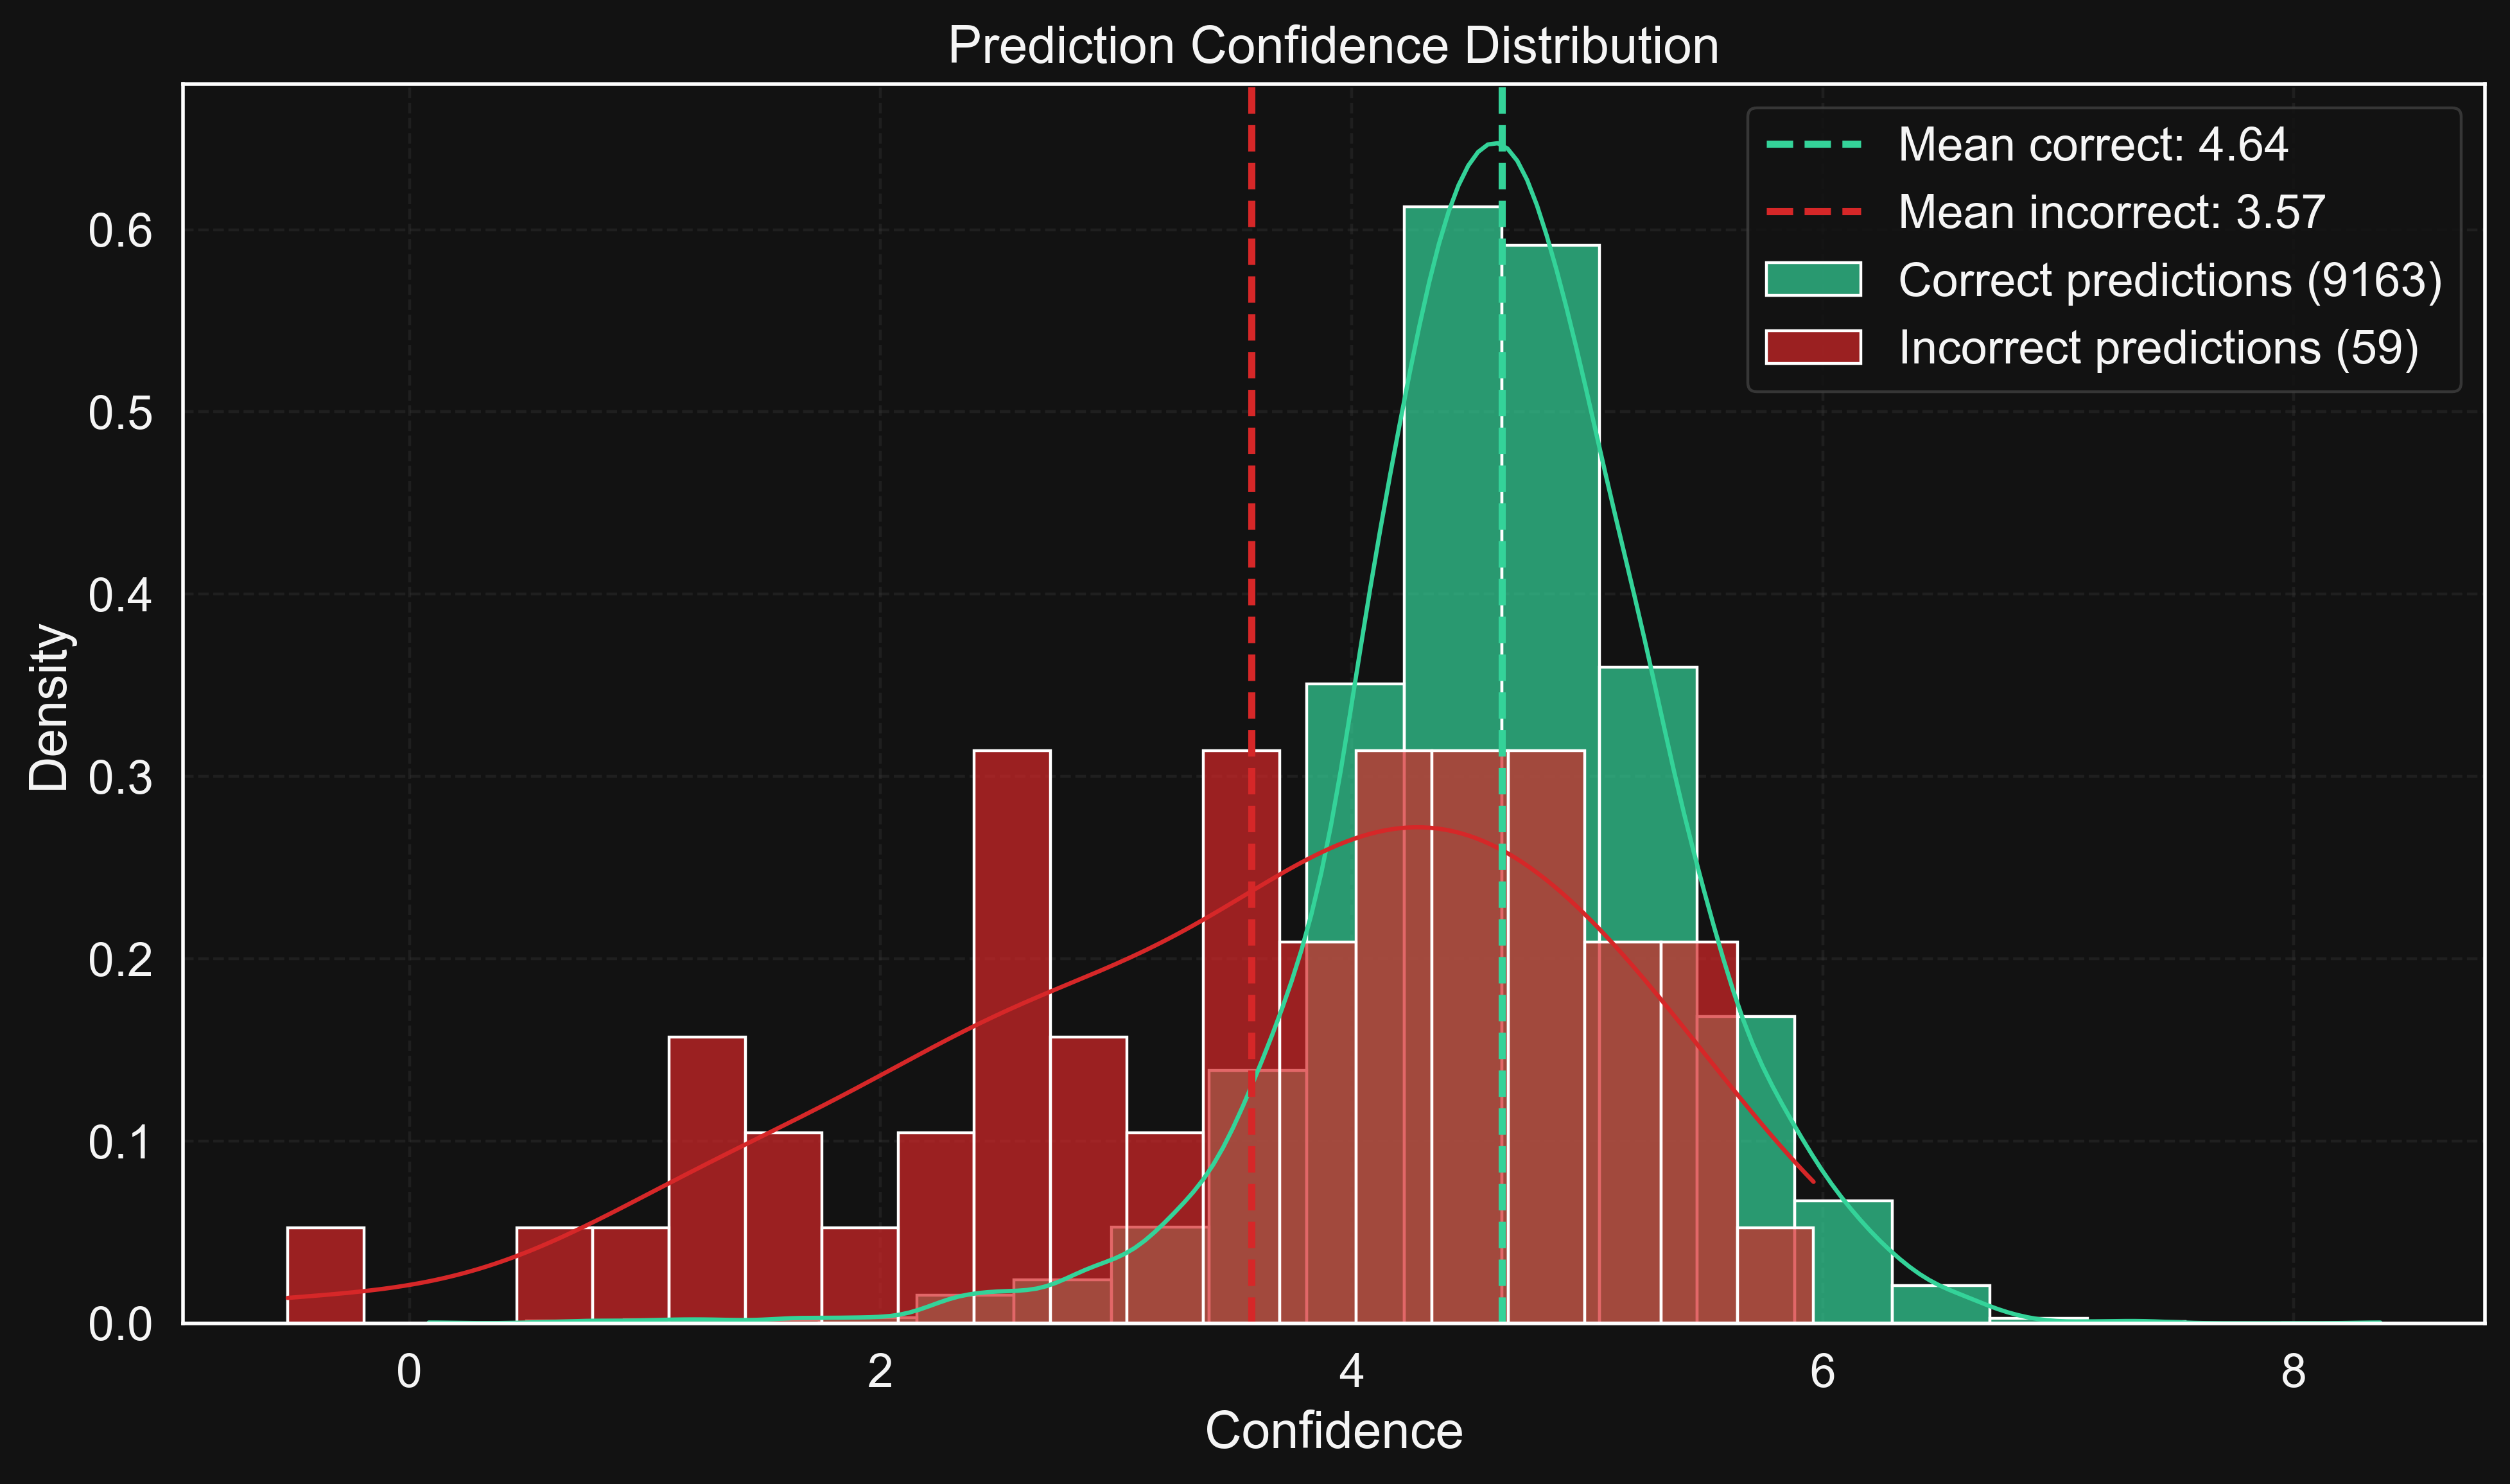
Histogram showing the distribution of prediction confidences across all test samples. The model shows a low average confidence of N/A.
Performance metrics across all 39 classes.
The cbam_only_resnet18 convolutional neural network achieved an overall accuracy of 97.46% on the challenging 39-class plant disease classification task. This performance underscores the model's capacity for effective feature extraction and robust generalization.
The cbam_only_resnet18 model exhibits exceptional efficacy in classifying plant diseases, achieving high precision and recall rates. Through in-depth metric evaluation and interpretability visualizations, we have delineated the model's strengths and identified actionable insights for further refinement. These results support the model's readiness for deployment in production environments.